Which pillar of Total Productive Maintenance (TPM) allows machine operators to gain more knowledge about and take greater ownership of their equipment?
Answer
Pillar 1 - autonomous maintenance
Card 302
Question
Which SPC chart should be selected with the following conditions: attribute output and the tracking of % defective desired with a sample size across the 25 tellers?
Answer
NP Chart
Card 303
Question
Which statement is most correct about regression analysis?
Answer
Non-linear regressions can explain curvature with more statistical confidence than linear regressions.
Card 304
Question
Which statements are correct about residuals from a proper, statistically correct linear regression analysis?
Answer
Residuals are the differences between observed and predicted values of data.
Card 305
Question
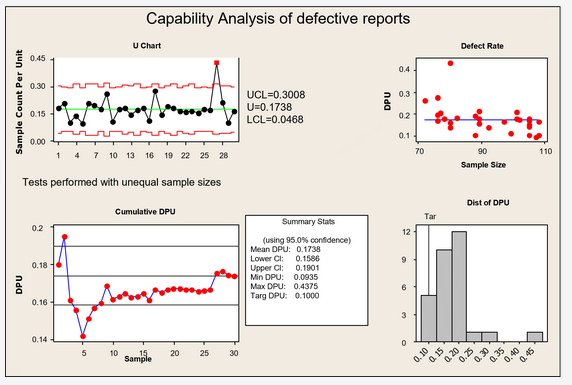
Which statements are correct about the advanced capability analysis shown below?
Answer
This is a Poisson capability analysis.
Card 306
Question
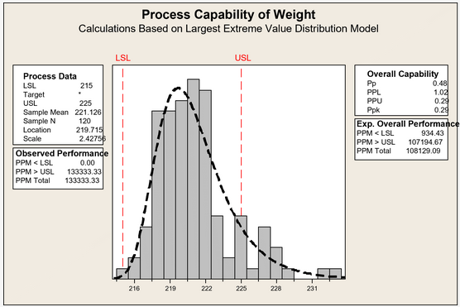
Which statements are true about the process shown? (image)
Answer
The majority of the process is within specifications.
Card 307
Question
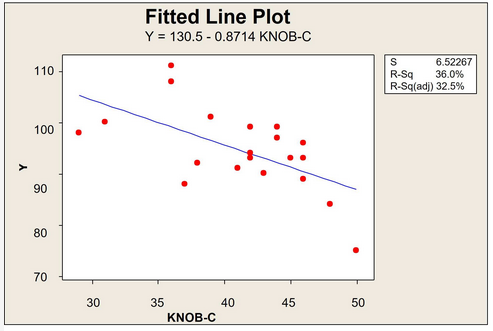
Which statements are true about the below regression?
Answer
Over 30% of the variation of the output is explained by the independent variable with the linear regression.
Card 308
Question
Which type of chart is appropriate when sample size is variable and each sample may contain more than one instance of the targeted condition?
Answer
U-Chart
Card 309
Question
While reviewing an X-bar control chart, you notice a set of seven consecutively decreasing points. You check previous control charts and notice that this is not a regular occurrence. What could have caused this behavior?
Answer
Machine deterioration
Card 310
Question
Why is it important to validate data sources?
Answer
To ensure the data is accurate and credible for decision making.
Card 311
Question
XYZ Company is a small business that fills water bottles on an assembly line. The Operations Division is in charge of tracking the amount of water filled in each bottle by the company's distribution equipment. An X-S chart is normally used to track the amount of water in each bottle, and groups the samples by 20. However, he could also monitor the process by doing which of the following?
Answer
Grouping the samples by 5 and using X-bar & R charts to track variations in amount..
Card 312
Question
You are a Belt and through analysis it was discovered that making a change in a process would increase throughput by 200 units per hour. Further analysis showed that the cost of fixing the process would be greater that the revenue gained from the increased throughput. Should you suggest this process change.
Answer
No, because there is not a Practical difference
Card 313
Question
You are a Belt asked to help find the source of variation in a process. It is discovered that most of the variation occurred during the night-shift. This would be an indication of what type of variation.
Answer
Temporal variation
Card 314
Question
You are mapping a process. What would be the best way to begin the mapping process?
Answer
Walk the actual process from beginning to end
Card 315
Question
You are studying the process of producing chicken feed. You want to find out if making a change to one of the pieces of equipment will change the daily mean output for that process by 12,000 pounds. Historically, the standard deviation of the daily production of chicken feed is 36,000 pounds. Which option represents the minimum sample size required to confirm the significance of a shift for the mean output that is more than 12,000 pounds at a 95% confidence level (Z=1.96), assuming a normal distribution?
Answer
35
How to use this set
Read the preview and check whether the content and answers suit your learning goal. You can add the public set to your sets to study it. Your account shows the available actions.