Which statements are correct about the advanced capability analysis shown below?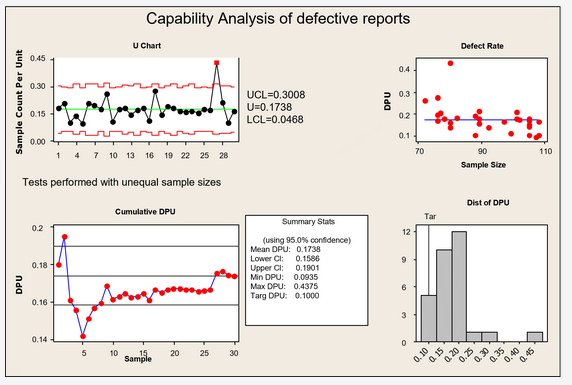
This is a Poisson capability analysis.
A study is being performed on the effects of video games on boys and girls. The x-axis on the chart represents time and the y-axis represents hyperactivity. Points are plotted along a line for boys and a separate line is plotted for girls. Which data plot in the following exhibit represents no interaction? (image)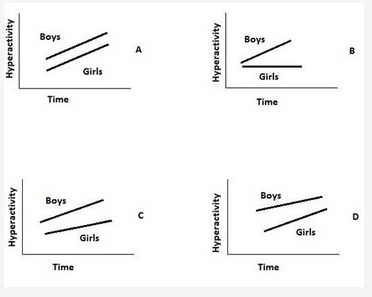
A
Which statements are true about the process shown? (image)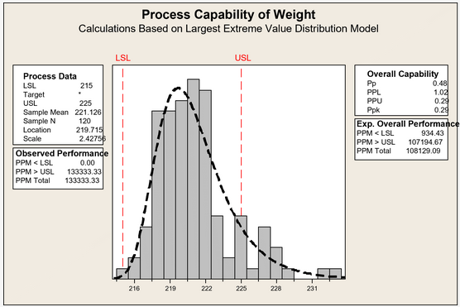
The majority of the process is within specifications.
Which statements are true about the below regression?
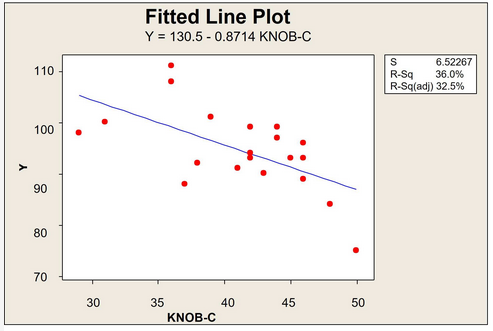
Over 30% of the variation of the output is explained by the independent variable with the linear regression.
